- Date2017-10-23 09:21
- View998
The Netherlands and EU's status of industries
that exceed the allowable exhaust standard for ammonia
Introduction
Scientists
has differentiated Ammonia (NH3) as a colourless,
pungent-smelling and corrosive gas that is produced by the decay of organic
vegetable matter and from the excrement of humans and animals. When released
into the atmosphere, ammonia increases the level of air pollution. Once
deposited in water and soils, it can potentially cause two major types of
environmental damage, acidification] and eutrophication (where over-fertilisation causes oxygen
depletion in water bodies as they become suffocated with weeds), both of which
can harm sensitive vegetation systems, biodiversity and water quality (Centre
for European Policy Studies, 2014).
Table 1. Uses of Ammonia
|
Industry |
Use |
|
Fertiliser |
production of: ?urea, (NH2)2CO
?
ammonium nitrate, NH4NO3 ?
other fertilisers; ammonium
sulfate, ammonium phosphate, diammonium phosphate, monoammonium phosphate ?direct
application |
|
Chemicals |
synthesis of: ? nitric acid, HNO3, which is used in making explosives such as
TNT (2,4,6trinitrotoluene), nitroglycerine which is also used as a
vasodilator (a substance that dilates blood vessels) and PETN
(pentaerythritol nitrate). ? sodium hydrogen carbonate (sodium bicarbonate), NaHCO3 ? sodium carbonate, Na2CO3 ? hydrogen cyanide (hydrocyanic acid), HCN ? hydrazine, N2H4 (used in rocket propulsion
systems) |
|
Explosives |
ammonium nitrate, NH4NO3 |
|
Fibres and
Plastics |
nylon, -[(CH2)4-CO-NH-(CH2)6-NH-CO]-,and
other polyamides |
|
Refrigeration |
used for making ice, large scale refrigeration plants,
air-conditioning units in buildings and plants |
|
Pharmaceuticals |
used in
the manufacture of drugs such as sulfonamide which inhibit the growth and
multiplication of bacteria that require p-aminobenzoic acid (PABA)
for the biosynthesis of folic acids, anti-malarials and vitamins such as the
B vitamins nicotinamide (niacinamide) and thiamine. |
|
Pulp and Paper |
ammonium hydrogen sulfite, NH4HSO3,
enables some hardwoods to be used |
|
Mining and Metallurgy |
used in nitriding (bright annealing) steel, used in zinc
and nickel extraction |
Source: Centre for European Policy Studies,
2014
The European Union and The Netherlands have
regulated ammonia emissions in the European Union (EU) especially in
agriculture, livestock, and manufacture. Ammonia emissions from agriculture
mainly occur as a result of volatilisation from livestock excreta (the
vaporisation of a dissolved sample), whether this occurs from livestock
housing, manure storage, urine and dung deposition in grazed pastures, or following manure spreading on
agricultural land. A smaller proportion of ammonia emissions result from the
volatilisation of ammonia from nitrogenous fertilisers and from fertilised crops.
Figure 1. Top ten global ammonia
producers, 2012 (k tonnes)
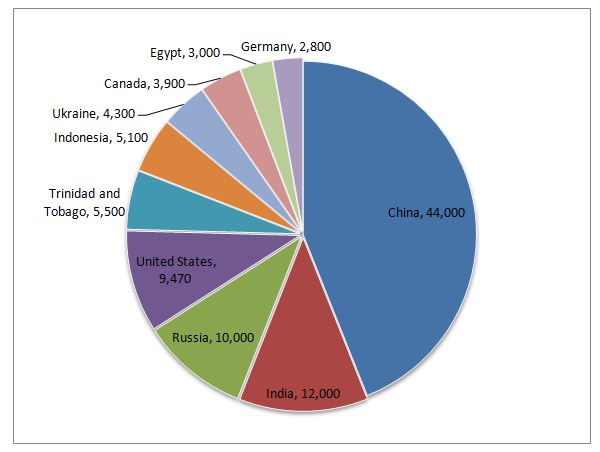
Source: Eurostat, 2013
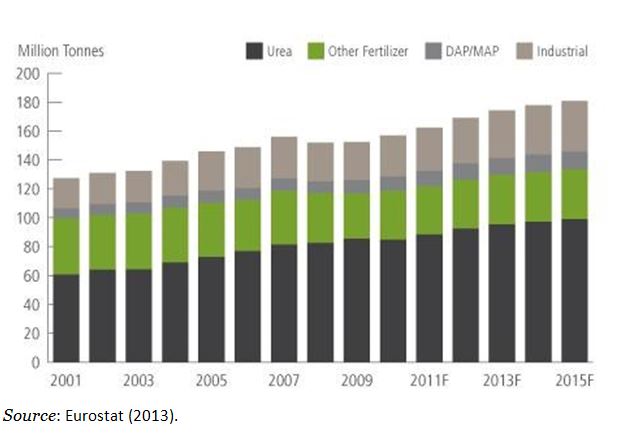
The two
main drivers of ammonia consumption are the use in the agricultural sector and
the development of applications for industrial purposes; both have determined
the increase of consumption of ammonia in the last decade. Interestingly, as
shown in Figure 2,the moderate drop in
consumption during the recent global economic downturn (2008- 2009) has been
mostly triggered by a decline in the demand for industrial applications; this
can be explained by the strong agricultural fundamentals in developing countries
that managed to limit the fall in consumption.
Through its resource use, agriculture changes
rural landscapes and contributes to resource depletion and degradation. Via
substance emissions into the wider environment, agriculture may contribute to a
complex series of ecological impacts, including human health effects, biodiversity loss and climate change. In the European Union, policy responses to
environmental concerns have included the introduction of: resource use
constraints and limits; emission and concentration limits; best available
techniques, methods and practices. Nature conservation policies have also been
implemented that set various agricultural constraints (European Environment
Agency, 2015).
Agri-environmental indicators can be used to
analyse, over time, the effects of agriculture on the environment and the
interaction between the two, as well as the effectiveness and efficiency of
agricultural and environmental policy measures. A Communication from the
European Commission to the Council and European Parliament titled, ‘The development of agri-environmental indicators for
monitoring the integration of environmental concerns into the Common
Agricultural Policy’
(COM(2006) 508) identified 28 agri-environmental indicators (AEIs) to help with this
assessment; Eurostat (2013) coordinates the work within the EEA on the
development of these indicators.
A number of steps have been taken to limit the
potential impacts of ammonia emissions. The European Parliament and
Council’s Directive 2008/1/EC on Integrated Pollution Prevention and
Control (IPPC) ― until 2013 ― requires industrial and agricultural activities
with a high pollution potential to have a permit. This permit can only be
issued if certain environmental conditions are met, so that the companies
themselves bear responsibility for preventing and reducing any pollution they
may cause. The Directive explicitly requires EU Member States to take measures
to reduce ammonia emissions on livestock holdings that have at least 40 000 places
for poultry, 2 000 places for production of pigs (over
30 kg) or 750 places for sows. In 2010 the IPPC directive was
recasted and integrated into the Industrial Emissions Directive 0075/2010 together with 6 other EU
directives regulating large industrial sites.
The Council’s Nitrates Directive 1991/676/EEC
aims to protect water quality across Europe by preventing nitrates from
agricultural sources polluting ground and surface waters and by promoting the
use of good farming practices. The EU Member States agreed to national emissions ceiling (NEC) targets for 2010 under the
European Parliament and Council’s Directive 2001/81/EC, with possible further emission reductions
thereafter. The purpose of these national emission ceilings was to reduce the
total emissions of the four pollutants responsible for acidification,
eutrophication and ground-level ozone pollution (sulphur dioxide, nitrogen
oxides, volatile organic compounds and ammonia). These targets were
subsequently broadly incorporated into the parallel and international UNECE
Convention on Long-Range Transboundary Air Pollutants (LRTAP) ― the so-called
Gothenburg Protocol; only the targets for the Czech Republic and Portugal were
slightly less ambitious than under the NEC Directive.
There are two other key factors that have had
an indirect impact on ammonia emissions from agriculture. The first is the
EU’s Common agricultural policy: the decoupling of subsidies under
the 2005 reform of the CAP has given an added impetus to the decline in
livestock numbers (for cattle and sheep in particular) as farmers are no longer
paid a subsidy for every breeding animal but rather a single farm payment, and;
the transition to open markets upon accession led to sharp falls in animal
prices and consequent declines in livestock farming in many of the Member
States that joined the EU in 2004 or 2007. The second factor is the level of
meat consumption in the EU and the change in composition of meat consumption
across Europe’s households, which may in part be linked to economic factors
(the rising price of meat) or to health issues (especially those linked to the
consumption of ‘red’ meats).
The majority of EU Member States also met
their individual LRTAP targets for 2010, the principal exceptions being
Germany, Finland, Croatia, Denmark, Spain and the Netherlands; Liechtenstein
and Norway also fell short of their targets. The downward pressure on ammonia
emissions was further embraced with the ratification of a revised Gothenburg Protocol on the 4 May 2012 in Geneva. The
amendments to the 1999 Protocol detail the national emission reduction
commitments from 2005 level for main air pollutants including ammonia to be
achieved in 2020 and beyond.
In 12 EU Member States, the level of reduction
was already below the target set out in the revised Protocol, among which
Bulgaria, Croatia and Cyprus were ahead by more than 10 percentage points
(pp). The 2013 ammonia emissions in the Czech Republic, Austria, Germany,
France and Estonia were still above the 2005 values. With a deficit of more
than 9 pp, Estonia, Finland and Sweden were the countries that remained
further away from their 2020 targets.
Figure 2. Global ammonia consumption (mlntonnes)
Further, in total, agricultural activities in the EU-28 resulted in the emission of 3.6 million tonnes of ammonia in 2013. This represented a decline of almost 30 % compared with the level emitted in 1990 (see Table 1). Nevertheless, agriculture was still responsible for the vast majority (93.3 %) of total ammonia emissions in the EU-28 in 2013 (see Figure 1). Specifically, manure management (the capture, storage, treatment and use of animal manure) accounted for almost three fifths of agricultural ammonia emissions in the EU-28 in 2013, agricultural soil emissions accounting for the rest. In the European Union, France accounted for almost one fifth (19.5 %) of ammonia emissions from agriculture in the EU-28 in 2013 and Germany accounted for the next highest proportion (17.6 %). However, the trends in emission levels between these two Member States contrasted starkly: ammonia emissions from agriculture declined by 16.8 % in Germany between 1990 and 2013 but remained relatively unchanged (? 3.9 %) throughout the period in France. Among other EU Member States, developments were even more contrasting, with declines of 60?75 % in Bulgaria, Latvia, Lithuania, the Netherlands and Slovakia, but with a rise in Spain (+ 11.0 %). The main contributory reason for the increase in ammonia emissions from agriculture observed in Spain was the increased density of cattle, swine and poultry production. By contrast, the considerable reduction in emissions from agriculture that were recorded in the majority of countries was due mainly to changes in the management of organic manures, to the decreased use of nitrogenous fertilisers and to some reduction in livestock numbers (especially for cattle). By way of example, the considerable reduction in ammonia emissions from agriculture in the Netherlands was principally due to a change in manure management practices: manure spreading onto the surface of the soil has been phased out and replaced by either injection or ‘band spreading’ with a rapid incorporation of manure into the soil. Most ammonia volatilises within the first 12 hours, so speed of incorporation into the soil reduces nitrogen loss considerably (Ibid, 24).
Table 3: 2010 NH3 ceilings under the NEC Directive and the Gothenburg
Protocol (kt)
|
Country |
2010
NECD |
2010
CLRTAP Gothenburg Protocol ceilings |
2020
CLRTAP Gothenburg Protocol ceilings |
|
Austria |
66 |
66 |
62 |
|
Belgium |
74 |
74 |
70 |
|
Bulgaria |
108 |
108 |
56 |
|
Cyprus |
9 |
N/A |
5 |
|
Czech Republic |
80 |
101 |
64 |
|
Denmark |
69 |
69 |
63 |
|
Estonia |
29 |
N/A |
10 |
|
Finland |
31 |
31 |
31 |
|
France |
780 |
780 |
634 |
|
Germany |
550 |
550 |
545 |
|
Greece |
73 |
73 |
63 |
|
Hungary |
90 |
90 |
72 |
|
Iceland* |
N/A |
N/A |
N/A |
|
Ireland |
116 |
116 |
108 |
|
Italy |
419 |
419 |
395 |
|
Latvia |
44 |
44 |
15 |
|
Liechtenstein |
N/A |
0.15 |
N/A |
|
Lithuania |
84 |
84 |
35 |
|
Luxembourg |
7 |
7 |
5 |
|
Malta |
3 |
N/A |
2 |
|
Netherlands |
128 |
128 |
122 |
|
Norway |
N/A |
23 |
21 |
|
Poland |
468 |
468 |
267 |
|
Portugal |
90 |
108 |
47 |
|
Romania |
210 |
210 |
173 |
|
Slovakia |
39 |
39 |
24 |
|
Slovenia |
20 |
20 |
17 |
|
Spain |
353 |
353 |
357 |
|
Switzerland |
N/A |
63 |
59 |
|
Sweden |
57 |
57 |
47 |
|
Turkey* |
N/A |
N/A |
N/A |
|
United Kingdom |
297 |
297 |
283 |
* Iceland and Turkey do
not have a ceiling under either the NEC Directive or the Gothenburg protocol.
Source: Centre for European Policy Studies, 2014
The European Union’s total emissions of
ammonia declined by 27.0 % between 1990 and 2013 to 3.8 million
tonnes, a level below the reduced emission ceilings target of 4.33 million
tonnes that was agreed for the individual EU Member States under the Long-range Transboundary Air Pollution (LRTAP) Convention. The decline in EU-28 emissions was
sharpest in the period from 1990?95 (a 17.9 % reduction). After relatively
unchanged levels from 1995?99, ammonia emissions then declined relatively
steadily through until 2010 before stabilising in 2011 and continuing with a
slight downward trend until 2013.
Table 2. EU-27 capacity and number of plants per
country, 2013
COUNTRIES CAPACITY (k
tonnes) NUMBER OF % EU-27
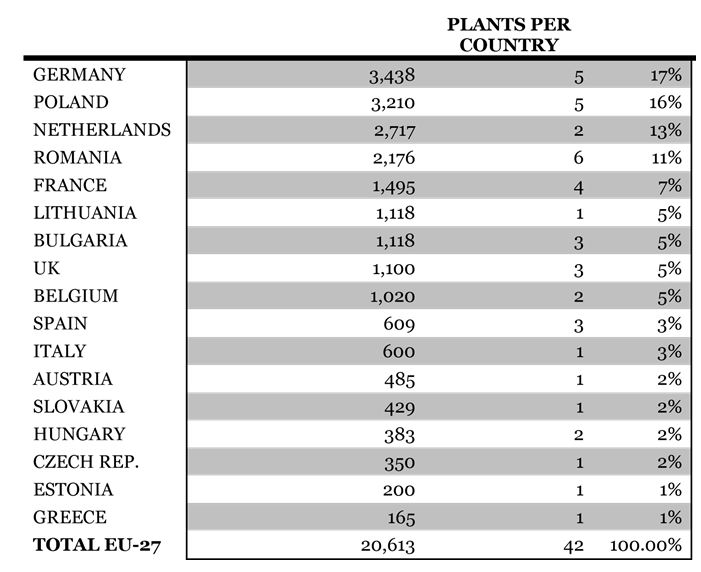
According
to the UNECE Convention on Long-range Transboundary Air Pollution, in order to ensure that no information can be
attributed to any specific plant, data have been aggregated together per three
major EU geographical regions. As already recalled, the sample covers 10
different member states; however, the number of ammonia plants per
region/country is not included in the report for confidentiality reasons and in
order to avoid any risk of identifying the plants included in the study:
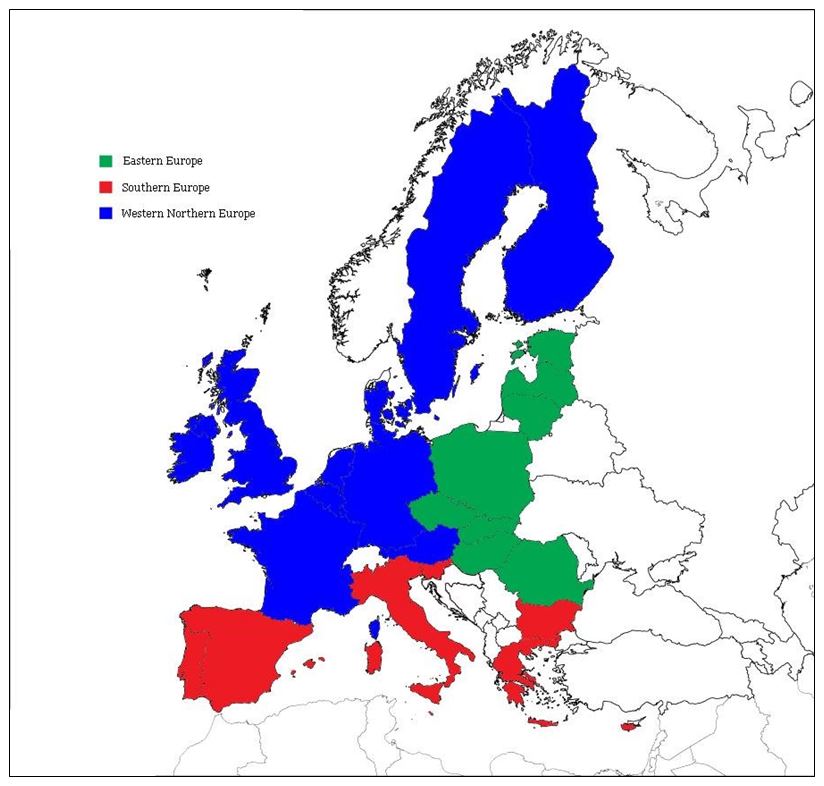
a.
Southern Europe(Italy, Malta, Portugal,
Greece, Slovenia, Cyprus, Spain and Bulgaria) is responsible for 12% of total
EU ammonia production capacity.
b.
Western
Northern Europe(UK, France, Belgium, Ireland, Luxemburg, Sweden, Germany, the
Netherlands, Finland, Denmark and Austria) is responsible 65% of total EU
ammonia production capacity.
c.
Eastern
Europe(Lithuania,
Romania, Czech Republic, Hungary, Estonia, Latvia, Slovakia and Poland) is
responsible for 23% of total EU ammonia production capacity.
In summary, agricultural activity was
responsible for the majority of ammonia emissions in each of the EU Member
States in 2013 compared to livelihoods and manufacturing sector. The wider
adoption of new manure management and fertiliser application practices, of
dietary changes that reduce nitrogen excretion from livestock, and of more
efficient use of nitrogen remain the key supply-side drivers in reducing total
ammonia emissions. Nevertheless, in a few countries the reductions from other
sources (such as solid waste disposal on land in Bulgaria and waste water
handling in Romania) are also key to the continued overall reduction in ammonia
emissions.
References:
Centre for European Policy Studies (2014). “Final
Report for a Study on Composition and Drivers of Energy Prices and Costs in
Energy Intensive Industries: The Case of the Chemical Industry ? Ammonia”
Council Directive promulgated 12 December
1991: Council
Directive of 12 December 1991 concerning the protection of waters against
pollution caused by nitrates from agricultural sources.
European
Environment Agency (2013). Ammonia Consumption.
Eurostat
(2013): EU-28’s Ammonia Consumption: History and Trajectories.
UNECE Convention on Long-range Transboundary Air
Pollution
(2013)
- PrevThe Netherlands and energy consumption of individual households: To operate a survey or not?
- NextThe Netherlands solid fuels circulation system